Creating charts from data can be time-consuming and complex. But InstaCharts changes the game.
InstaCharts is a tool designed to make chart creation simple and quick. With this tool, you can upload spreadsheet files and instantly generate beautiful, interactive charts. Whether you need to share insights with your team, embed visual data in a report, or just explore data trends, InstaCharts makes the process seamless. Its intuitive interface allows for easy customization of charts without diving into complicated menus. Plus, you can share your charts through public URLs or embed them on websites. If you’re looking for a way to simplify data visualization, InstaCharts is worth considering. Explore InstaCharts further by visiting their official page.

Credit: www.g2.com
Introduction To Instacharts
InstaCharts is a powerful tool designed to simplify the process of creating charts from spreadsheet files. This innovative platform allows users to quickly generate beautiful and interactive charts, unlocking valuable insights from their data efficiently. Let’s explore InstaCharts in detail.
What Is Instacharts?
InstaCharts is a user-friendly application that transforms raw data from spreadsheets into visually appealing charts. It supports various file formats such as CSV, Excel, TSV, and JSON. With InstaCharts, users can create charts instantly, customize them easily, and share them interactively.
Purpose And Importance In Social Media Analytics
The primary purpose of InstaCharts is to provide quick data insights through instant chart creation. This feature is particularly beneficial in social media analytics, where timely data visualization is crucial. By using InstaCharts, social media analysts can:
- Rapidly explore data trends and patterns
- Easily customize charts to fit their needs
- Share interactive charts with team members or embed them in reports
InstaCharts enhances collaboration by allowing users to share their charts via public URLs or embed them in webpages. The platform also offers versatile export options, enabling users to save their charts as .png or .svg files and export filtered data to .csv, .tsv, or .json formats.
| Feature | Description |
|---|---|
| Instant Chart Creation | Automatically generate charts from uploaded spreadsheet files |
| Easy Customization | Modify chart attributes with a simple UI |
| Interactive Sharing | Share charts with coworkers through public URLs or embed them in webpages |
| File Compatibility | Supports CSV, Excel, TSV, JSON file types |
| Smart Data Detection | Automatically detects column types and formatting |
| Export Options | Save charts as .png or .svg and export data to .csv, .tsv, or .json |
| Interactive Charts | Hover over data points for detailed insights |
| Data Table View | Presents data in a sortable, filterable table for easy analysis |
InstaCharts offers two pricing plans:
- Plan 1: $29 (one-time purchase, originally $120)
- Export chart images to .png or .svg
- Export data to .csv, .tsv, or .json
- Remove watermarks
- Shared charts/embeds up to 1,000 views/month
- Up to 10 MB file upload
- Overall 100 MB (compressed) storage
- Process up to 25,000 rows per spreadsheet
- Plan 2: $58 (one-time purchase, originally $240)
- All features from Plan 1
- Shared charts/embeds up to 100,000 views/month
- Up to 20 MB file upload
- Overall 500 MB (compressed) storage
- Process up to 100,000 rows per spreadsheet
InstaCharts also provides a 60-day money-back guarantee, ensuring users can try the tool and get a full refund if it doesn’t meet their needs. With lifetime access and future updates included, InstaCharts is a valuable tool for anyone looking to enhance their data visualization capabilities.
Key Features Of Instacharts
InstaCharts is a powerful tool designed to simplify the process of creating charts from spreadsheet files. It comes packed with various features that make data visualization easy and efficient. Below, we delve into some of the key features that make InstaCharts stand out.
With Real-time Analytics, InstaCharts allows users to see data updates as they happen. This feature ensures that you are always working with the most current data available. No more waiting for manual updates!
- Instant data refreshes
- Automatic detection of new data points
- Seamless integration with live data sources
The Comprehensive Dashboard of InstaCharts provides a holistic view of all your charts and data. The dashboard is designed to be intuitive and user-friendly, making it easy to navigate through various charts and datasets.
- Easy access to all charts
- Sortable and filterable data tables
- Customizable layout for better organization
InstaCharts enables effective Competitor Analysis by allowing users to compare their data with industry benchmarks. This feature helps in understanding market trends and making informed decisions.
- Side-by-side data comparison
- Benchmarking against industry standards
- Detailed insights on competitive performance
With Customizable Reports, InstaCharts offers the flexibility to create reports that suit your specific needs. Users can modify chart attributes and export data in various formats for broader usability.
- Easy modification of chart attributes
- Export options including .png, .svg, .csv, .tsv, and .json
- Interactive sharing through public URLs or embeds
For more details, visit InstaCharts.
Real-time Analytics
In the fast-paced world of data-driven decisions, having access to real-time analytics can be a game-changer. InstaCharts offers a powerful solution for instantly creating beautiful charts from spreadsheet files, making real-time data insights more accessible than ever.
Immediate Data Insights
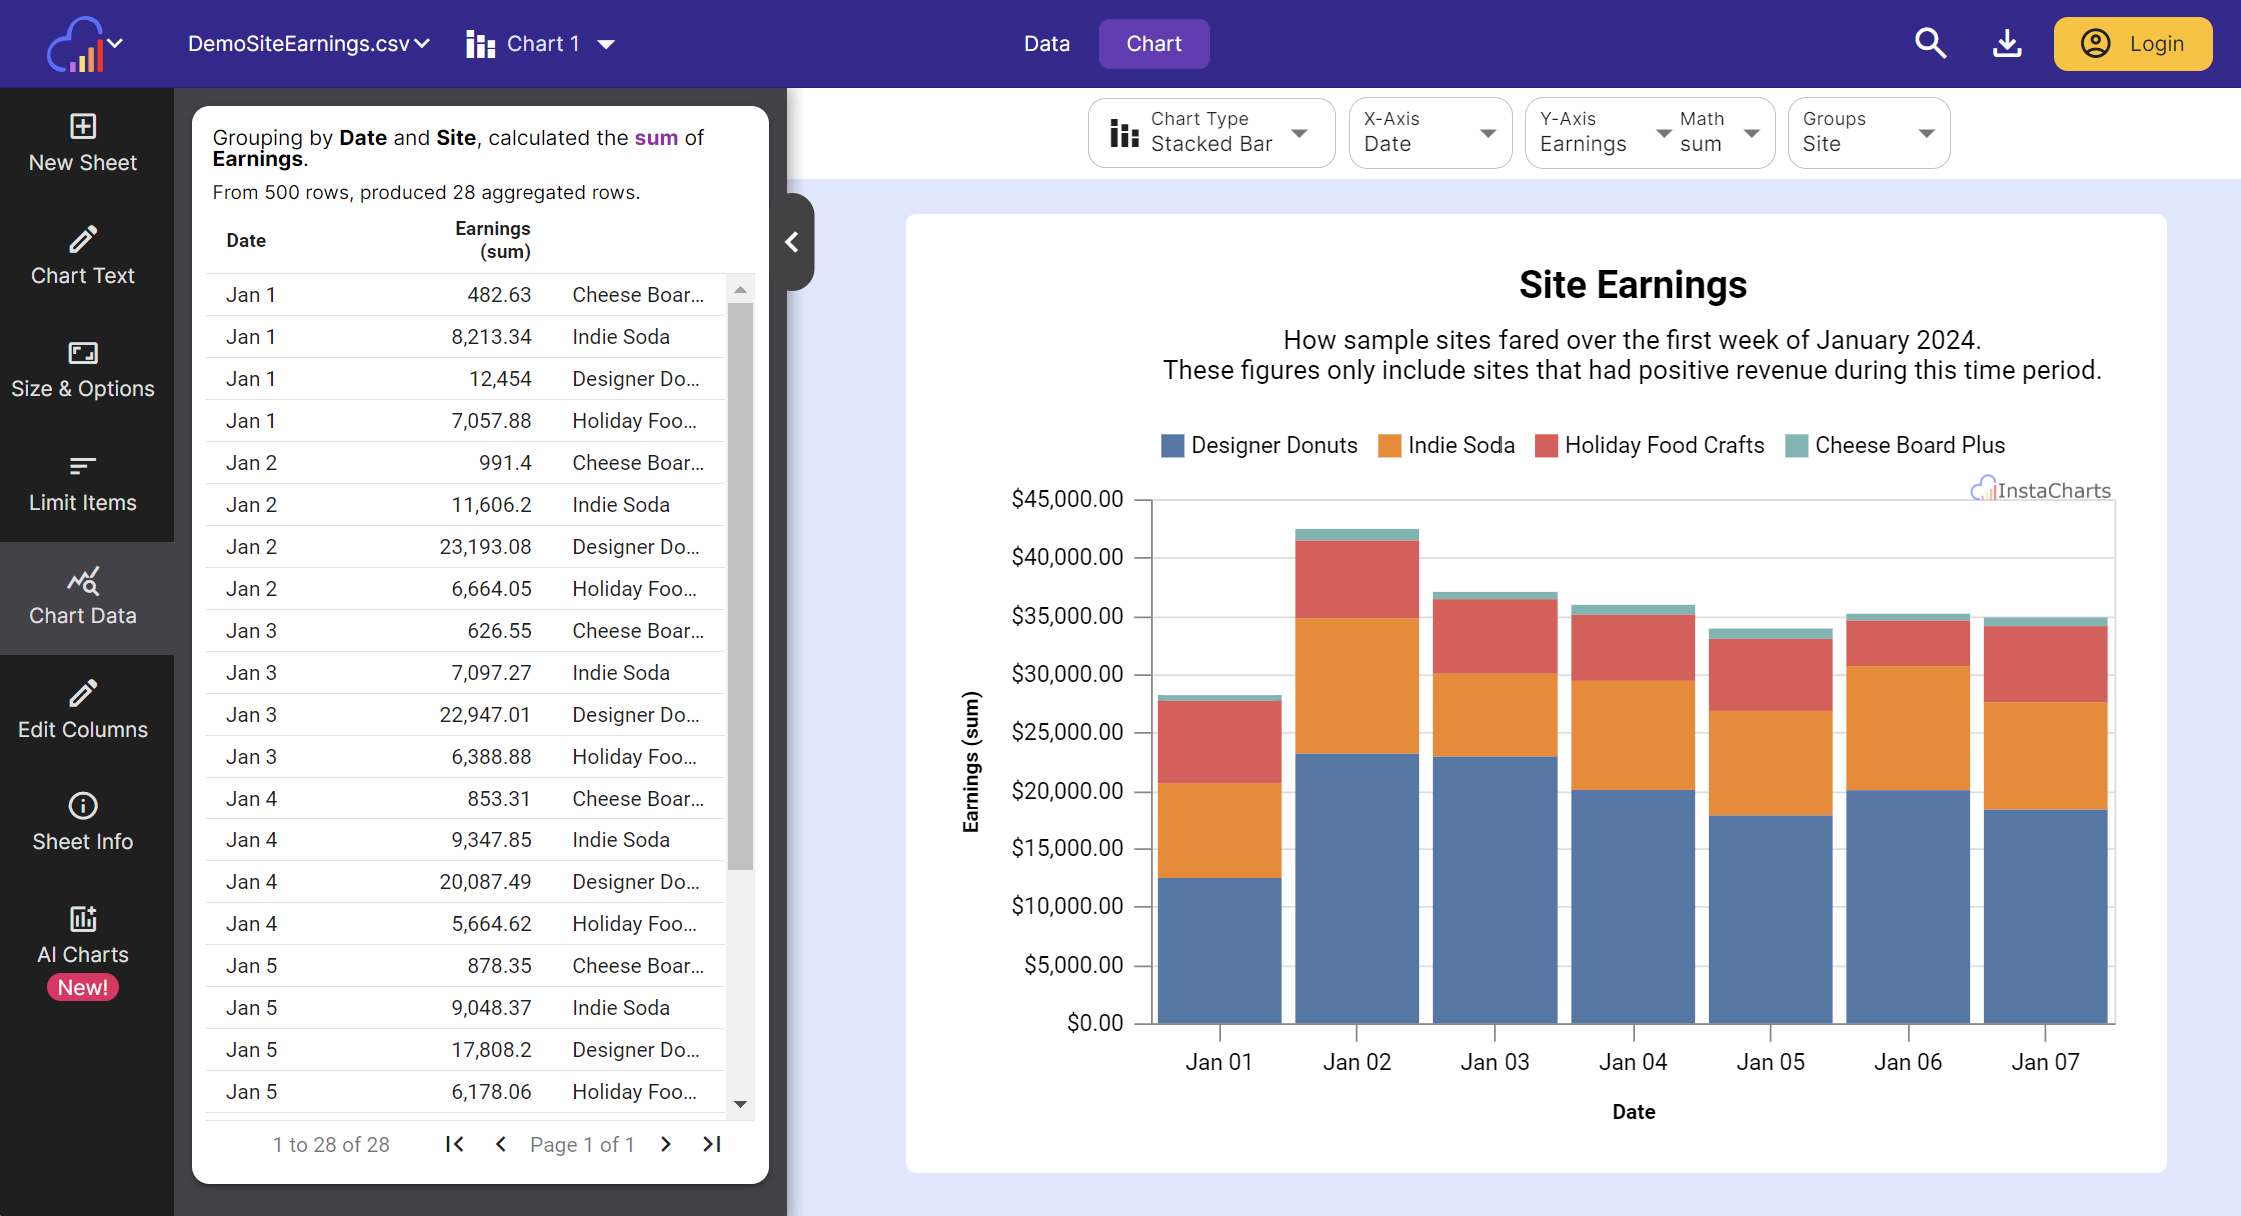
With InstaCharts, users can generate charts automatically from uploaded spreadsheet files. This feature allows you to unlock useful insights from your data quickly and efficiently. No need to navigate through complex menus; the simple UI ensures that you can modify chart attributes with ease.
Moreover, the software supports various file types, including CSV, Excel, TSV, and JSON, making it versatile for different data sources. The smart data detection feature ensures that column types and formatting are automatically recognized, simplifying the chart creation process further.
Advantages Of Real-time Monitoring
Real-time monitoring with InstaCharts offers several advantages:
- Quick Data Insights: Rapidly explore and visualize data trends.
- Ease of Use: Simplifies chart creation and customization, saving time and effort.
- Interactive Charts: Hover over data points for detailed insights.
- Data Table View: Presents data in a sortable, filterable table for easy analysis.
These features collectively enhance the efficiency of your data analysis process, allowing you to make informed decisions promptly.
Impact On Social Media Strategy
Real-time analytics can significantly impact your social media strategy. By using InstaCharts, you can monitor key metrics in real time and adjust your strategies accordingly. This can help in identifying trends, understanding audience behavior, and measuring the effectiveness of your campaigns.
Moreover, the interactive sharing feature allows you to share charts with coworkers through public URLs or embed them in webpages. This enhances collaboration and ensures that everyone is on the same page, making it easier to align your team’s efforts towards common goals.
In summary, InstaCharts provides a robust platform for real-time analytics, enabling immediate data insights, offering several advantages for monitoring, and positively impacting your social media strategy.

Credit: www.youtube.com
Comprehensive Dashboard
InstaCharts offers a comprehensive dashboard designed to simplify chart creation and data visualization. This dashboard is packed with features that enhance user experience and make data insights accessible at a glance.
User-friendly Interface
The dashboard boasts a user-friendly interface that simplifies navigation. Users can upload spreadsheet files and generate charts instantly. The interface is intuitive, ensuring even beginners can create professional charts without hassle.
Easy customization options allow users to modify chart attributes effortlessly. You don’t need to navigate through complex menus. Everything you need is right at your fingertips.
All-in-one View Of Metrics
The dashboard provides an all-in-one view of metrics, making it easy to monitor key data points. Users can hover over data points for detailed insights. This feature helps in quickly identifying trends and patterns.
The data table view presents data in a sortable, filterable format. This makes analysis straightforward and efficient. Users can export filtered data to various formats, including CSV, TSV, and JSON.
Customizable Widgets
InstaCharts’ dashboard includes customizable widgets that allow users to personalize their workspace. These widgets can be adjusted to display the most relevant data, providing a tailored view of metrics.
Users can save and share interactive charts online through public URLs or embed them in webpages. This enhances collaboration and makes it easy to share insights with team members or stakeholders.
Export options allow users to save charts as .png or .svg files. This versatility ensures that charts can be used across various platforms and reports.
InstaCharts supports multiple file types, including CSV, Excel, TSV, and JSON. This broad compatibility ensures that users can work with data from various sources without any issues.
Competitor Analysis
In the crowded space of data visualization tools, InstaCharts sets itself apart through its unique features and ease of use. This section dives deep into how InstaCharts compares with its competitors, revealing its strengths and strategic advantages.
Benchmarking Against Competitors
When comparing InstaCharts with other chart creation tools, several aspects stand out:
| Feature | InstaCharts | Competitor A | Competitor B |
|---|---|---|---|
| Instant Chart Creation | Yes | No | Yes |
| Easy Customization | Yes | Yes | Limited |
| File Compatibility | CSV, Excel, TSV, JSON | CSV, Excel | CSV |
| Export Options | .png, .svg, .csv, .tsv, .json | .png, .csv | .png |
| Interactive Sharing | Yes | No | Yes |
Market Trends And Insights
The data visualization market is evolving rapidly with an increasing demand for tools that offer:
- Ease of Use: Users prefer intuitive tools that require minimal learning curve.
- Versatility: Compatibility with various file types and export options.
- Collaboration Features: Ability to share and embed charts seamlessly.
InstaCharts caters to these trends with its simple UI, broad file compatibility, and interactive sharing capabilities. This positions InstaCharts well in the current market.
Strategic Advantage
InstaCharts offers several strategic advantages:
- Lifetime Access: One-time purchase with lifetime updates.
- Cost-Effective Plans: Affordable pricing with a range of features.
- Enhanced Collaboration: Share charts with public URLs or embed in web pages.
These advantages make InstaCharts an attractive option for users seeking an efficient and cost-effective data visualization solution.
Customizable Reports
InstaCharts makes data visualization easy with its customizable reports. Users can quickly create and modify charts to fit their needs, ensuring that the data is presented in the most effective way.
Tailored Reporting Options
With InstaCharts, users can tailor their reports to meet specific requirements. The platform supports various file types, including CSV, Excel, TSV, and JSON, making it versatile for different data sources. The easy customization feature allows users to modify chart attributes through a simple UI. This means no more navigating through complex menus.
Users can adjust elements such as:
- Chart types (bar, line, pie, etc.)
- Colors and themes
- Data labels and legends
- Axis titles and formatting
Ease Of Sharing Insights
Sharing insights with InstaCharts is straightforward. The interactive sharing feature allows users to share charts via public URLs or embed them in webpages. This facilitates immediate feedback and discussion. Additionally, charts can be exported as .png or .svg images, ensuring they are ready for presentations or reports.
Key sharing options include:
- Public URLs for easy access
- Embeddable charts for websites
- Export options to .png and .svg
Enhanced Collaboration
InstaCharts enhances collaboration by allowing multiple users to access and interact with the same charts. The sortable and filterable data table view makes it easy for team members to analyze data together. This promotes a more interactive and collaborative environment.
Collaboration features include:
- Interactive charts with hover details
- Real-time data updates
- Shared views up to 100,000 per month (Plan 2)
With these features, InstaCharts is not just a tool for creating charts, but a platform for fostering teamwork and effective data communication.
Pricing And Affordability
InstaCharts offers competitive pricing with valuable features that cater to various user needs. Let’s dive into the details of their pricing structure and assess the affordability.
Subscription Plans
| Plan | Price | Features |
|---|---|---|
| Plan 1 | $29 (one-time purchase, originally $120) |
|
| Plan 2 | $58 (one-time purchase, originally $240) |
|
Cost-benefit Analysis
The affordable pricing of InstaCharts makes it a great choice for users who need quick and easy chart creation. Here’s a simple cost-benefit analysis:
- Plan 1: For $29, users gain essential features that simplify chart creation and data export. The plan is ideal for small teams or individual users.
- Plan 2: At $58, users get extended capabilities with higher storage and view limits. This plan suits larger teams or businesses with more extensive data needs.
Both plans offer great value considering the one-time purchase, which means no recurring fees.
Free Trial And Discounts
InstaCharts offers a 60-day money-back guarantee. This allows users to try the service risk-free and get a full refund if not satisfied.
Additionally, users benefit from lifetime access and all future updates with their purchase. The one-time payment ensures users do not worry about recurring costs.
Discounts are already applied, making the plans even more attractive compared to their original prices. This provides substantial savings for users.
Pros And Cons Of Instacharts
InstaCharts offers a streamlined solution for creating interactive charts from spreadsheet files. Below, we dive into the strengths and areas for improvement based on user feedback, along with some real user testimonials.
Strengths Based On User Feedback
InstaCharts has several strengths that users appreciate:
- Instant Chart Creation: Users love the ability to automatically generate charts from uploaded spreadsheet files.
- Easy Customization: The simple UI makes modifying chart attributes straightforward without complex menus.
- Interactive Sharing: Sharing charts via public URLs or embedding them in webpages is hassle-free.
- File Compatibility: Supports multiple file types including CSV, Excel, TSV, and JSON.
- Smart Data Detection: Automatically detects column types and formatting, saving time.
- Versatile Export Options: Charts can be saved as .png or .svg, and data can be exported to .csv, .tsv, or .json.
Areas For Improvement
While InstaCharts is highly rated, users have pointed out some areas for improvement:
- Storage Limitations: The storage capacity could be increased to handle larger datasets.
- View Limits: The number of shared chart views per month may need expansion for heavy users.
- File Size Restrictions: Increasing the maximum file upload size would benefit users with extensive data.
User Testimonials
Here are some testimonials from InstaCharts users:
| User | Feedback |
|---|---|
| John D. | “InstaCharts made creating and sharing charts with my team very easy. The interface is intuitive and the export options are versatile.” |
| Emily R. | “I appreciate the instant chart creation feature. It saves me a lot of time when analyzing data.” |
| Michael T. | “The only downside is the storage limit. It works well for smaller datasets, but larger files can be a challenge.” |
Ideal Users And Scenarios
InstaCharts is a powerful tool designed to simplify the creation of charts from spreadsheet files. It is ideal for various users and scenarios, making it versatile and valuable in different contexts.
Best For Social Media Managers
Social media managers often need to present data in a visually appealing manner. InstaCharts offers instant chart creation and easy customization, allowing them to quickly generate and modify charts. Sharing charts is simple with public URLs or by embedding them in webpages. This feature is crucial for presenting engagement metrics, follower growth, and content performance.
Suitable For Small To Large Enterprises
Both small and large enterprises can benefit from InstaCharts. Small businesses can use the basic features to understand their data better. Large enterprises can leverage the advanced capabilities like export options and interactive sharing for more in-depth analysis and collaboration. The pricing plans are flexible, accommodating different needs and budgets.
| Plan | Price | Features |
|---|---|---|
| Plan 1 | $29 |
|
| Plan 2 | $58 |
|
Industries And Use Cases
InstaCharts serves a variety of industries:
- Marketing: Visualize campaign performance and audience insights.
- Finance: Quickly interpret financial data and trends.
- Education: Present research data and academic statistics.
- Healthcare: Analyze patient data and treatment outcomes.
Use cases include creating interactive charts for reports, presentations, and websites. InstaCharts enhances data visualization and makes it easier to communicate complex data.
Credit: www.getapp.ie
Frequently Asked Questions
What Is Instacharts?
Instacharts is a data visualization tool that helps you create interactive charts. It’s user-friendly and requires no coding skills.
How Does Instacharts Work?
Instacharts works by allowing users to upload data and customize charts. It offers various chart types and design options.
Is Instacharts Free To Use?
Instacharts offers both free and premium plans. The free plan includes basic features. Premium plans provide advanced options.
Can I Use Instacharts For Business?
Yes, Instacharts is ideal for businesses. It helps visualize data, making it easier to analyze and present.
Conclusion
InstaCharts offers a simple way to create and share beautiful charts. Its ease of use and powerful features make data visualization quick and efficient. Users can enjoy interactive sharing, versatile export options, and smart data detection. Whether you’re working solo or with a team, InstaCharts enhances your data insights effortlessly. To learn more or purchase, visit the link below. Get InstaCharts here.

